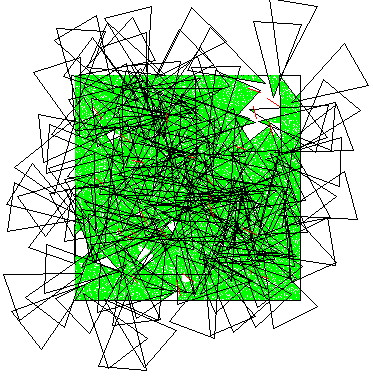
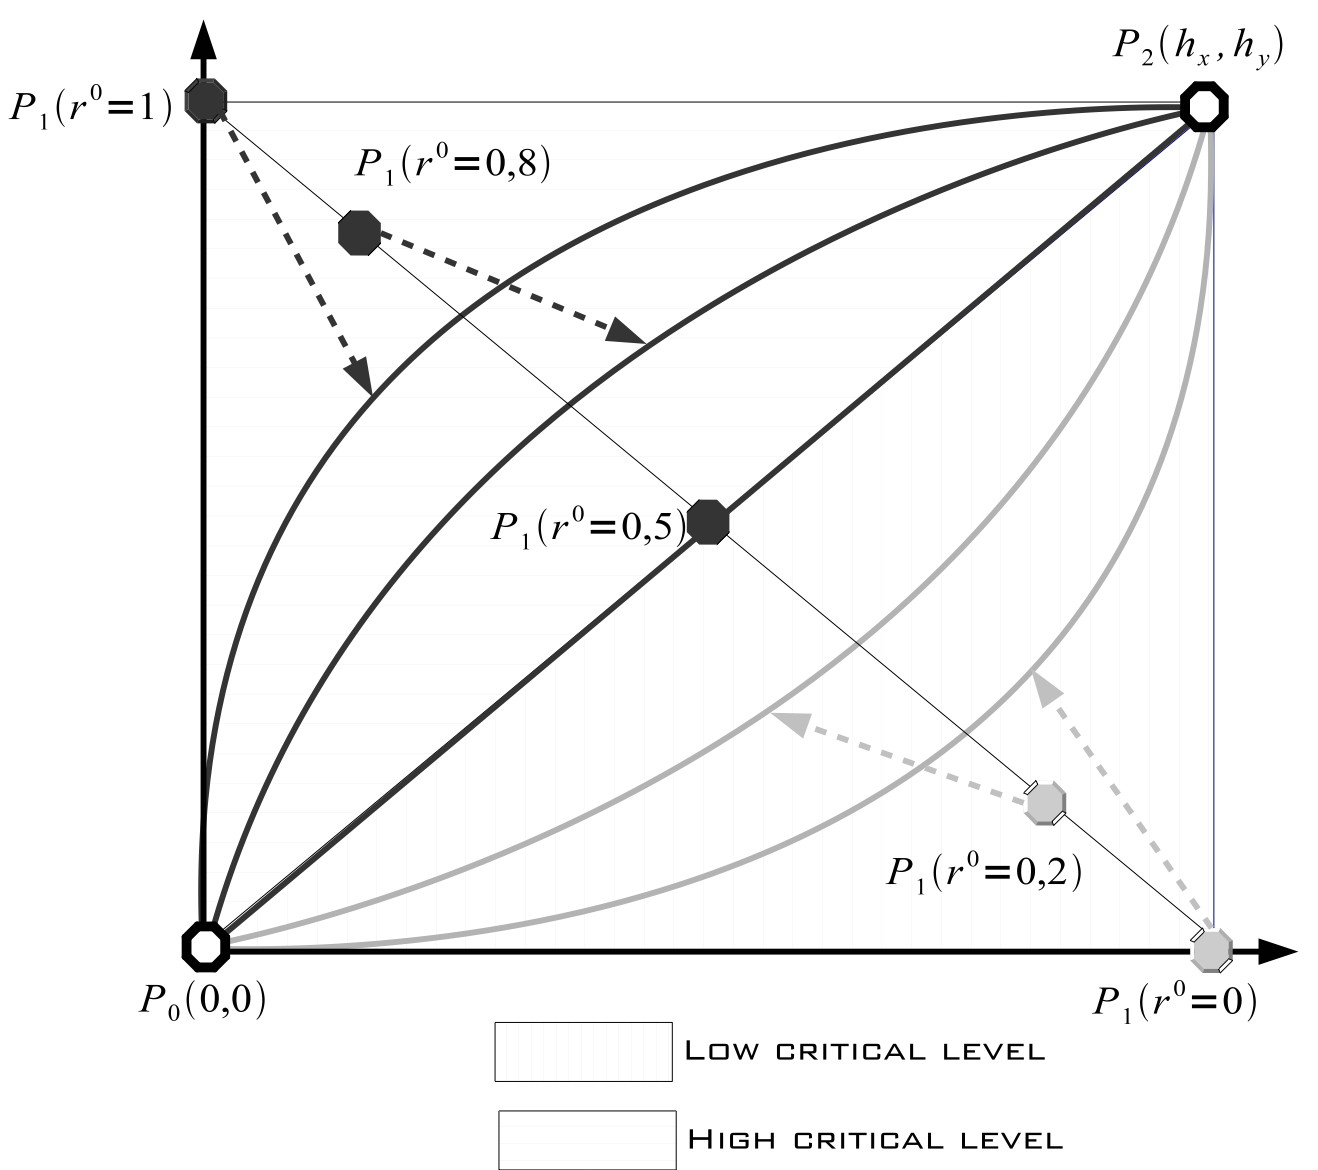
The x axis defines the number of cover
sets and the corresponding capture rate can be read on the y axis for a
given criticality level (r°). As said previously, the criticality
is set to 0.4 in the default
omnetpp.ini
file.
To define the Bezier curves, we need the maximum number of cover sets
that will give the maximum frame capture rate (point P2 on the figure).
The maximum capture rate in currently set to 6fps in the
videoSensorNode.h
file. The number of cover set a sensor node can have depends on the
node density and on the randomly set line of sight at each simulation
run. We set the maximum number of cover sets for a sensor node to 6 as
a parameter in the .ned file. Each sensor will read this value at
simulation startup. Then the simulation model currently applies a
scaling factor of 2 which give 12 as the maximum number of cover sets
that will be used to compute the Bezier curves. Therefore, for a
maximum number of cover set equal to 12, we can vary r° to have the
following capture rates.
#cover
1 2 3
4 5 6
7 8 9
10 11 12
-------------------------------------------------------------------
r0=0.00 0.01 0.05 0.11 0.20 0.33 0.51 0.75 1.07 1.50 2.10 3.04 6.00
r0=0.20 0.14
0.30 0.50 0.73 1.01 1.34 1.73 2.20 2.78 3.52 4.50 6.00
r0=0.40 0.34
0.71 1.09 1.50 1.94 2.41 2.90 3.43 4.00 4.62 5.28 6.00
r0=0.60 0.72
1.38 2.00 2.57 3.10 3.59 4.06 4.50 4.91 5.29 5.66 6.00
r0=0.80 1.50
2.48 3.22 3.80 4.27 4.66 4.99 5.27 5.50 5.70 5.86 6.00
r0=1.00 2.96
3.90 4.50 4.93 5.25 5.49 5.67 5.80 5.89 5.95 5.99 6.00
In the simulation model you could of course change the maximum number
of cover set, the maximum capture rate and the
getCaptureRate()
function in
videoSensorNode.cc
will determine the correct capture rate depending on the criticality
level.
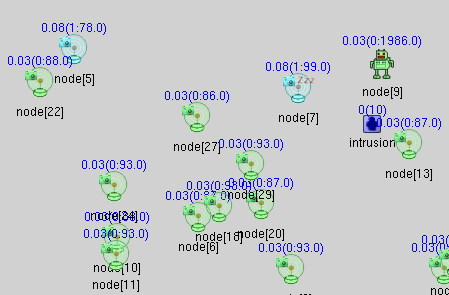
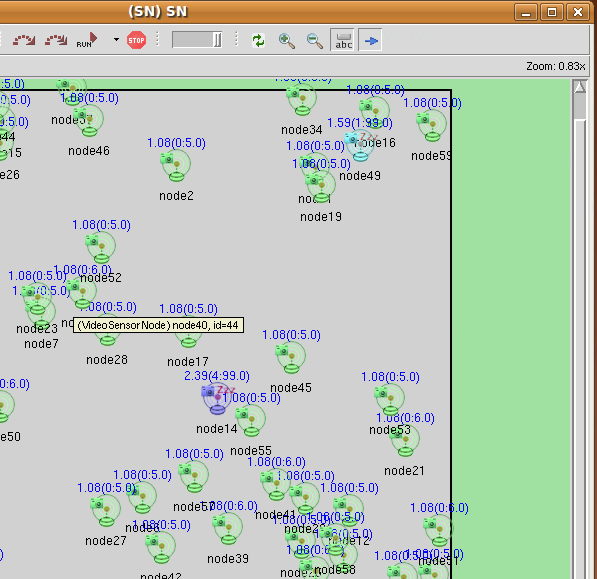
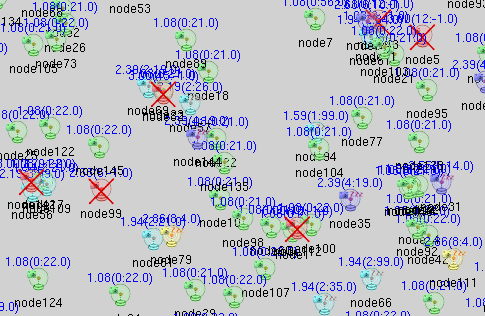
During the simulation the sensor node icon color will change to
indicate for each
sensor node the number of cover sets that are not dead (not the initial
number of found cover sets that is displayed by the information string,
see above). The color code is as follows, assuming that N is the
maximum number of cover set defined (12 for instance):
- n > N, icon color is red
- n > N/2, icon color is yellow
- n > N/4, icon color is blue
- n > 1, icon color is cyan
- n = 0, icon color is green
An example is shown below where you can see the green, cyan, blue,
yellow and dead
icons. The icon color meaning is valid even when the sensor node is
inactive. But when the sensor node is dead, there is no more color
indication.
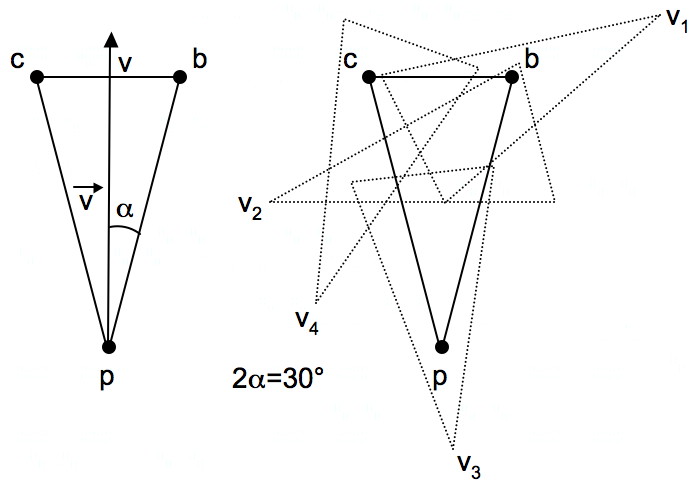

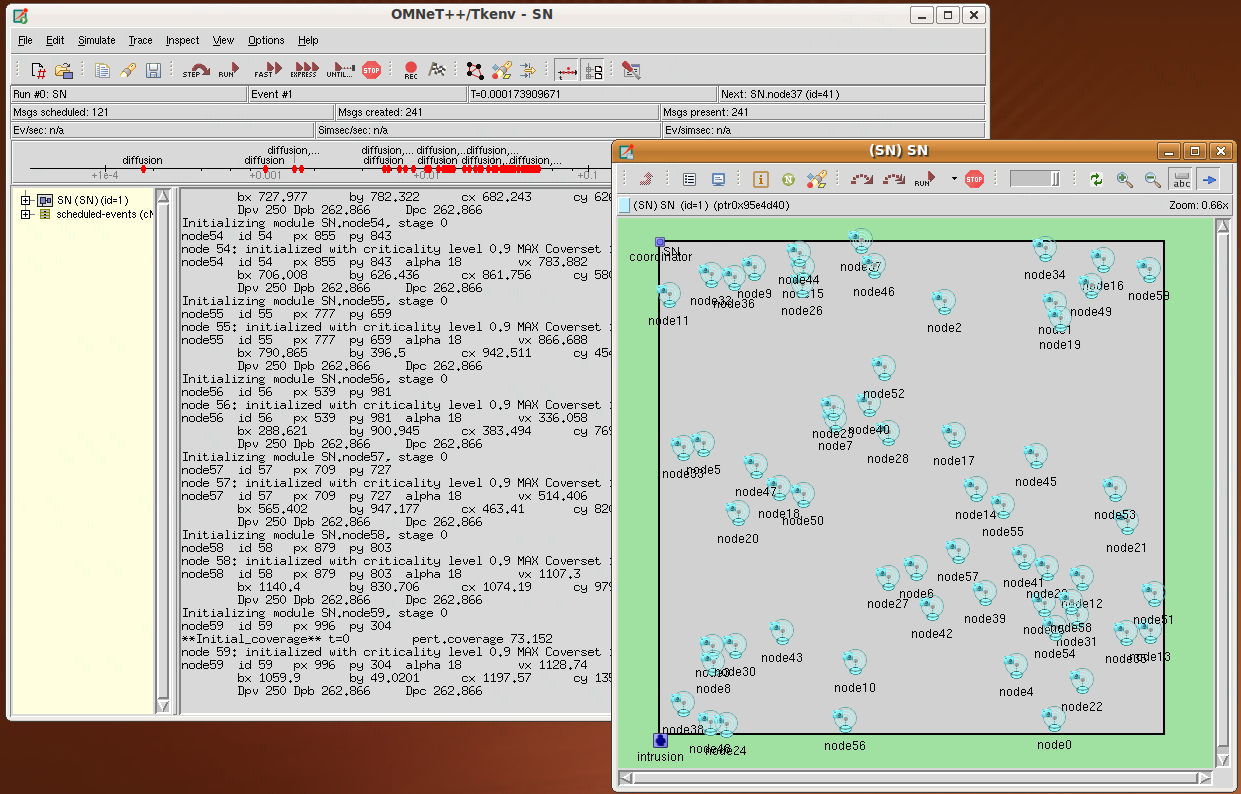


 ,
,  .
. . There are also
icons for dead and sleeping robots:
  ,
,  .
.
 icon. Its position will also be
graphically updated as it moves. An information string will be
displayed on top of the icon indicating the number of time the
intrusion has been seen, and the number of remaining intrusions.